So far, we've grabbed some data, then made a chart to work out the average of the whole for each skill. In a bonus section to part two, I answered some questions about formatting.
This is written on the assumption that you've been following the series so far. Now let's grab some more data and create a new table. This one will automatically calculate how much XP is needed to your next level in every Runescape skill.
Runescape Excel Hiscores Tracker: Adding More Data
Before we can calculate the XP needed, we need to know the amount that causes you to level up. This is probably the easiest insertion of data for you, because I'm going to provide it!
- Open your Runescape Hiscores Tracker Excel Workbook.
- Select the worksheet with your raw data in it.
- Copy and paste the following in cell H1:
1
2
3
4
5
6
7
8
9
10
11
12
13
14
15
16
17
18
19
20
21
22
23
24
25
26
27
28
29
30
31
32
33
34
35
36
37
38
39
40
41
42
43
44
45
46
47
48
49
50
51
52
53
54
55
56
57
58
59
60
61
62
63
64
65
66
67
68
69
70
71
72
73
74
75
76
77
78
79
80
81
82
83
84
85
86
87
88
89
90
91
92
93
94
95
96
97
98
99
- Copy and paste the following in cell I1:
0
83
174
276
388
512
650
801
969
1154
1358
1584
1833
2107
2411
2746
3115
3523
3973
4470
5018
5624
6291
7028
7842
8740
9730
10824
12031
13363
14833
16456
18247
20224
22406
24815
27473
30408
33648
37224
41171
45529
50339
55649
61512
67983
75127
83014
91721
101333
111945
123660
136594
150872
166636
184040
203254
224466
247886
273742
302288
333804
368599
407015
449428
496254
547953
605032
668051
737637
814445
899257
992895
1096278
1210421
1336443
1475581
1629200
1798808
1986068
2192818
2421087
2673114
2951373
3258594
3597792
3972294
4385776
4842295
5346332
5902831
6517253
7195629
7944614
8771558
9684577
10692629
11805606
13034431
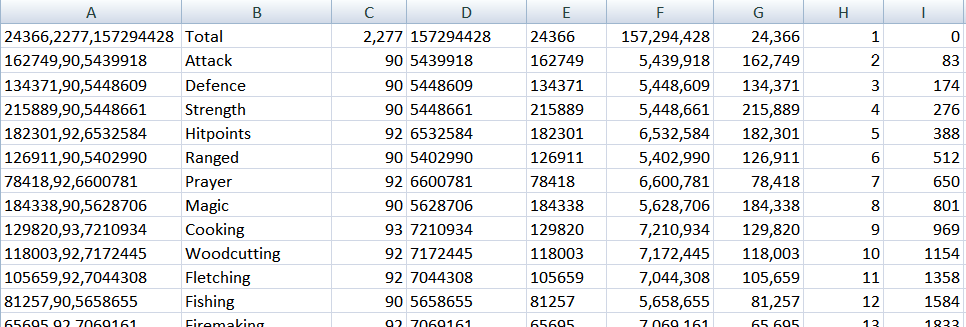
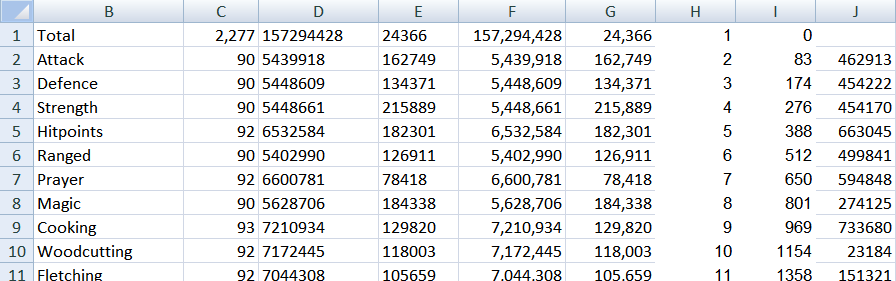
All done! My data sheet looks like this:
Runescape Hiscores Tracker: Naming Your Ranges
There is a formula coming up that's going to require us to name a range. We'd better do that then.
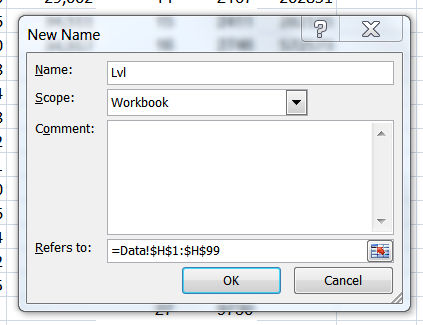
- Click on cell H1 (which should currently have a 1 in it).
- Drag your mouse down to H99 (which should currently have a 99 in it).
- Right-click anywhere in the highlighted area.
- Select 'Name a Range' from the pull down menu.
- Call it 'Lvl' and click 'OK'.
- Do the same for cells I1 to I99.
- Call it 'Exp'.
Now that our columns of information are named, we can use that in a formula that looks things up on them. This is precisely what we're going to be doing next.
Looking Up The XP to Your Next Runescape Level in Excel
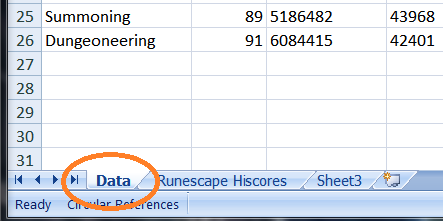
The worksheet, with all of my data in it, is imaginatively called 'Data' in my Excel workbook. It's important that you note what you called your tab, because it's going to be used in the next formula.
- Click on cell J2.
- Copy and paste the following formula:
=IF(LOOKUP(C2+1,'Data'!Lvl,'Data'!Exp)-D2<0,0,(LOOKUP(C2+1,'Data'!Lvl,'Data'!Exp)-D2)) - Change Data to whatever you called this page. (Or leave it alone, if you called the worksheet 'Data'. :p)
- Press enter.
- Woot at the fact that the XP to your next Attack level should be revealed.
- Click on cell J2 again.
- Left-click on the tiny square in the bottom, right-hand corner of the cell.
- Drag it down to cell J26.
- Happy dance.
This is how my data sheet looks now:
We have our data all calculated. All that remains now is to format it into a pretty table.
Creating a Table Charting the Experience Remaining
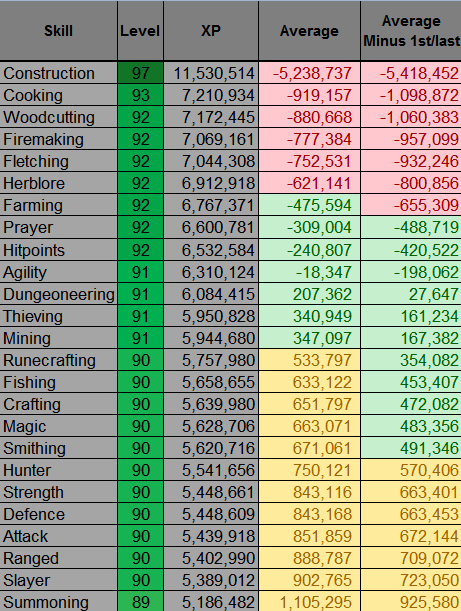
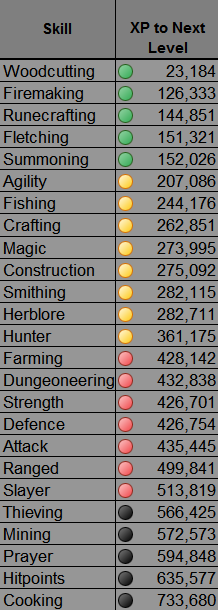
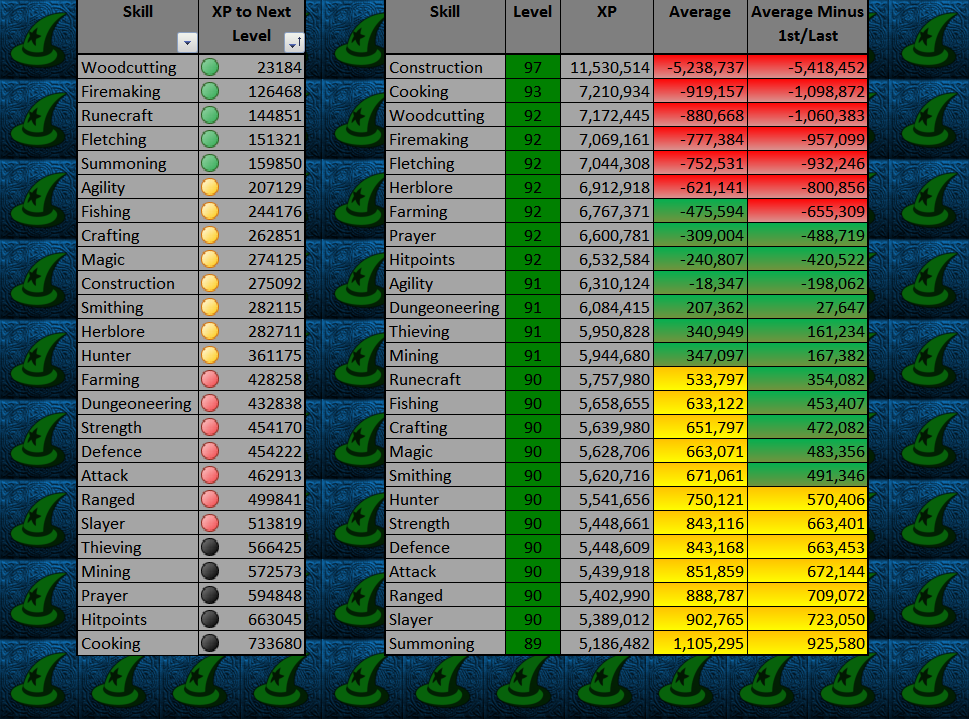
I'm going to walk you through creating a table that looks like this:
Obviously, you might want to add your own artistry to it. Please do feel free to colour and decorate it as you wish!
Open up your main worksheet, where you last created the Averages table. Mine is huddled up in the first five columns, so I'm going to move it along a bit.
- Click the A to highlight the first column.
- Right-click and select 'insert'.
- Repeat that another three times.

- Click cell E1.
- Right-click and select 'copy'.
- Click cell B1.
- Right-click and select 'paste'.
- Drag that over to C1, using the little corner box.
- Click on C1.
- Type 'XP to Next Level'.
- Widen the C column, by clicking your cursor on the wall between C and D and dragging.
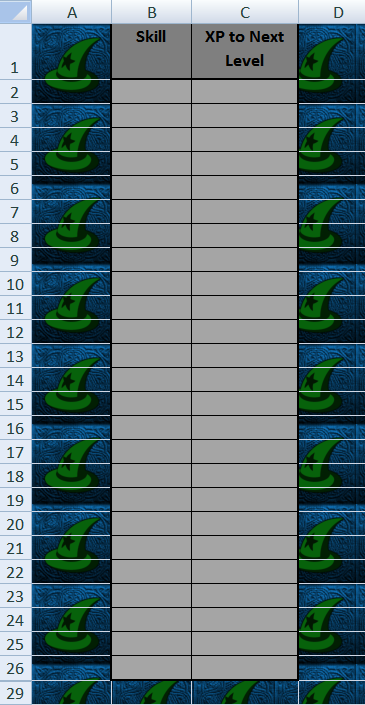
- Highlight the cells B2 to C26.
- Colour them in using the paint bucket.
This part is really formatting the cells to look pretty. I went through it this when we were making the Averages table, and added some more tips in the bonus blog, so please consult them.
I'm going for a light grey with full borders and gridlines.
Once it's all pretty, it's simply a case of adding a couple of formulas.
- Click on B2.
- Copy and paste this formula: =Data!B2.
- Drag the formula down to B26.
- Widen your B column, if necessary. (The word Dungeoneering will probably make it necessary.)
- Click on C2.
- Copy and paste this formula: =Data!J2.
- Drag the formula down to C26.
Voila! All of your information in a handy table! But I want to add a bit more decoration, just to give it a splash of colour.
- Highlight cells C2 to C26.
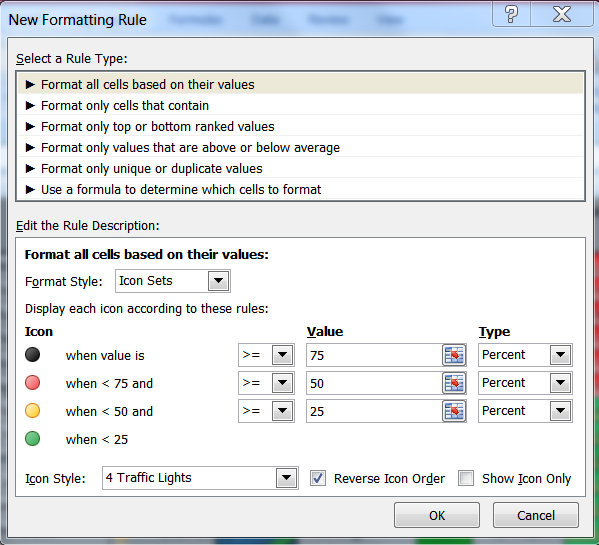
- Click on 'Conditional Formatting', in the styles section of the Home tab toolbar.
- Select 'Icon Sets'.
- Select 'More Rules'.
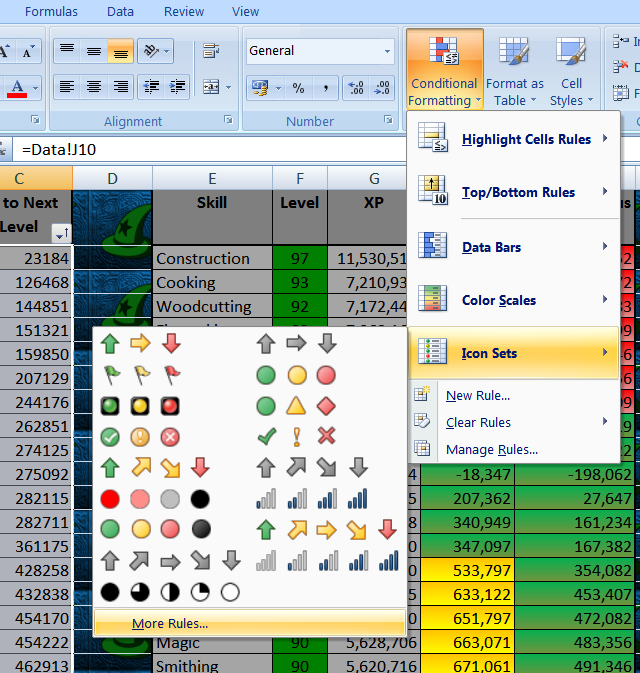
- Pull down the menu beside 'Icon Style'.
- Select '4 Traffic Lights'.
- Tick the box beside 'Reverse Icon Order'.
- Click Ok.
There are loads of icon sets in there. If this one isn't thrilling you, then try another in the same way. But before we declare this table done, there's a big decision to make about filters.
Excel Worksheets: The Limitations of the Sort Filter
You could add a sort filter, as you did with the Averages table. Unfortunately a limitation of Excel is that you can only have one of these filters on any single worksheet. There is a work-around using macros, but that's a bigger job, so a tip for another day. For now, just decide which table you wish to have the handy button filter on. The other can be sorted manually by highlighting it and using 'sort and filter' to arrange it.
NB Do not sort the columns headed 'Average' and 'Average Minus 1st/Last', else it will lose the formatting.
I've opted to put the button filter on the XP table.
Two Runescape Hiscore Tracker Tables in Excel
There we have it. You now have two lovely and useful tables, nestled side by side on your Excel worksheet.
Next time, we'll look at how to add Activity Logs and more.
There is a work-around using macros, but that's a bigger job, so a tip for another day. For now, just decide which table you wish to have the handy button filter on.Cheap LOL Boost
ReplyDeleteelo boosting service
Great Information sharing .. I am very happy to read this article .. thanks for giving us go through info.Fantastic nice. I appreciate this post.
ReplyDeletenightmare zone
I have recently started a blog, the info you provide on this site has helped me greatly. Thanks for all of your time & work.
ReplyDeletevital-eloboost.com